A3 Limited Edition Blossom Risograph Print
A3 Limited Edition Blossom Risograph Print
Couldn't load pickup availability
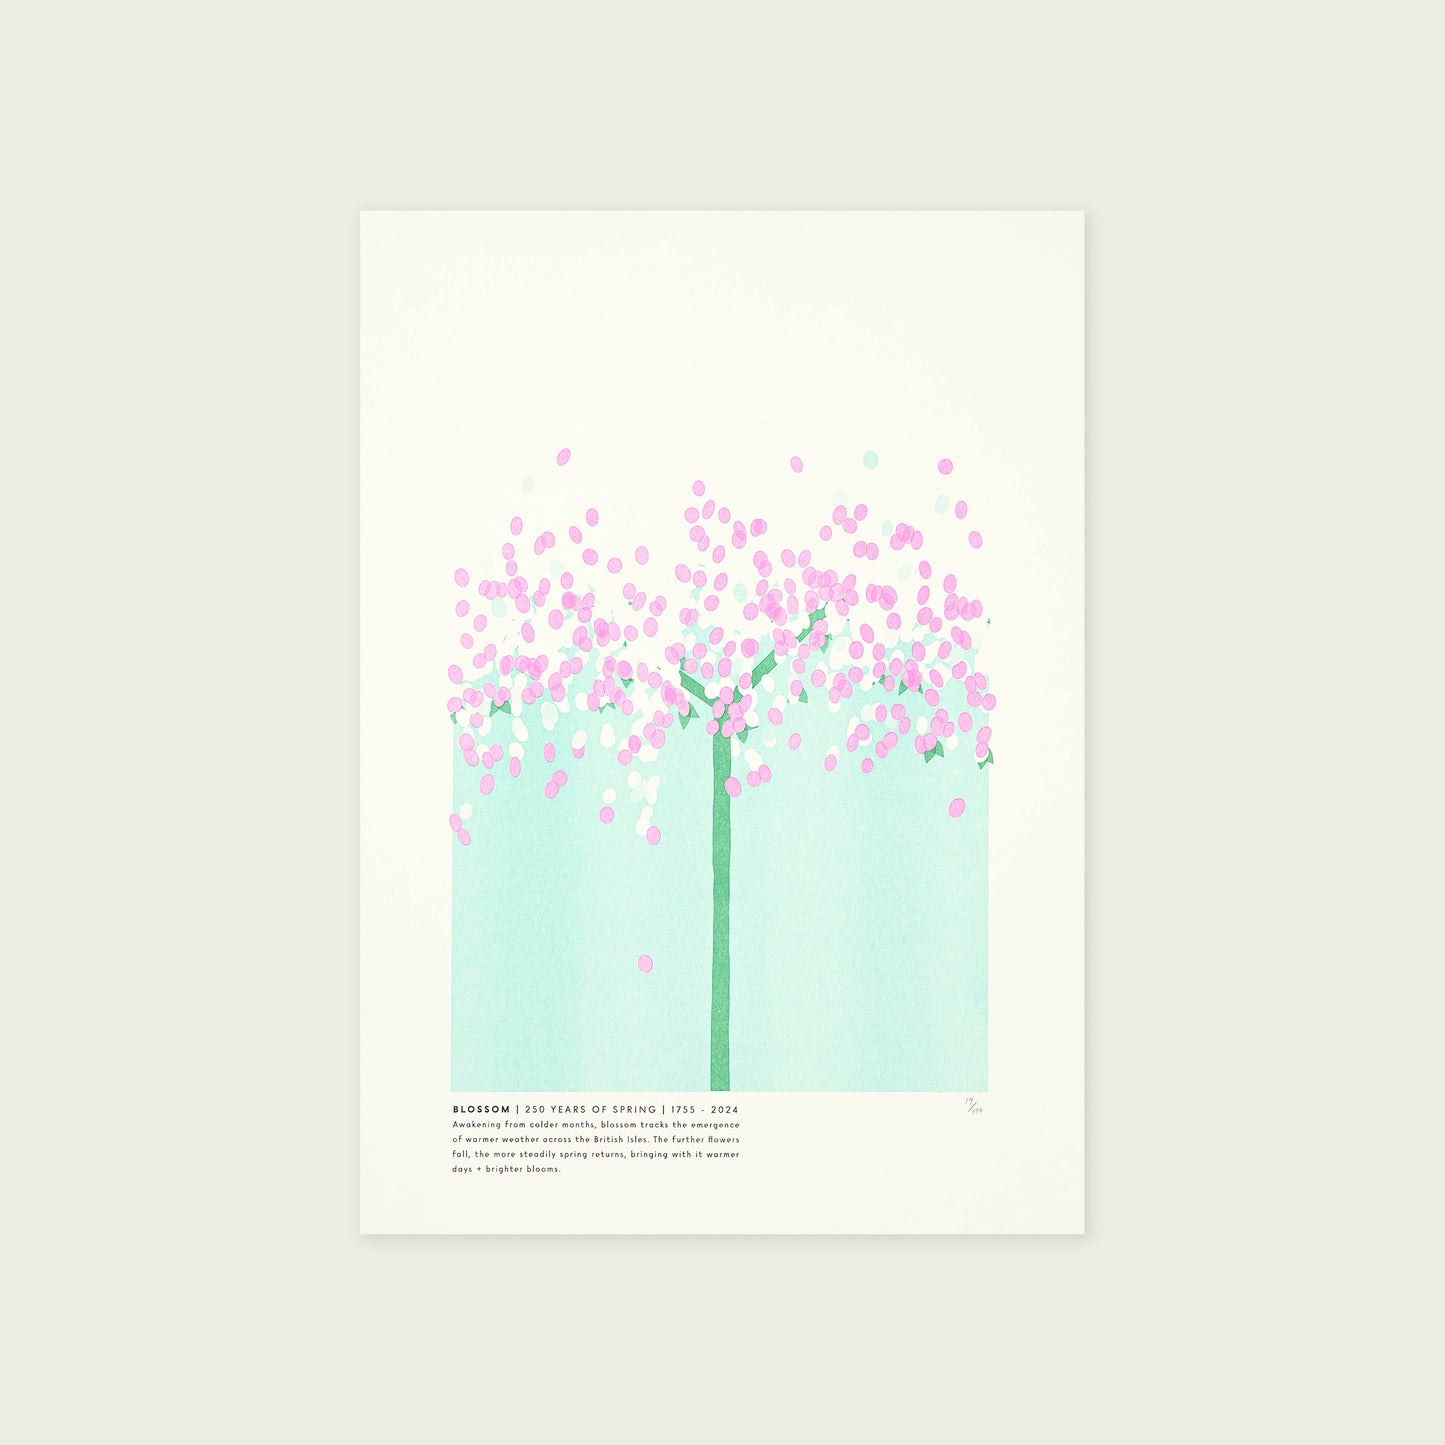
Tracking the emergence of spring across 250 years.
Blossom blooms at different times from year to year depending on the weather. Cold winters warming into spring are the ideal conditions for early blooms.
Looking purely at temperature data. The story is fairly predictable. Temperatures are increasing in more recent years.
But this print didn't set out to purely track temperatures. It was sparked by the joy of spring, symbolised within the soft pink flowers of blossom. And blossom itself is all about renewal.
It also seems lazy to have thousands of rows of data, full of stories, and see only the things that we already suspect.
And so I set out to find some interesting patterns.
The thing about emergence is that it happens gradually. And for the weather to consistently warm, it has to begin pretty cold.
And so I set out to find the years that follow this pattern. Consistently, and gradually, warming from the depths of winter. Just like blossom trees bloom.
The most interesting thing about this story is that it's full of surprises. As in it's not predictable. This pattern of slow emergence happened 200 years ago but is also happening now.
Specification
297mm W x 420mm H (A3)
Limited Edition (100) Risograph
4 Colour: Fluorescent Pink, Mint, Green and Black
175gsm Natural Coloplan Paper
Details
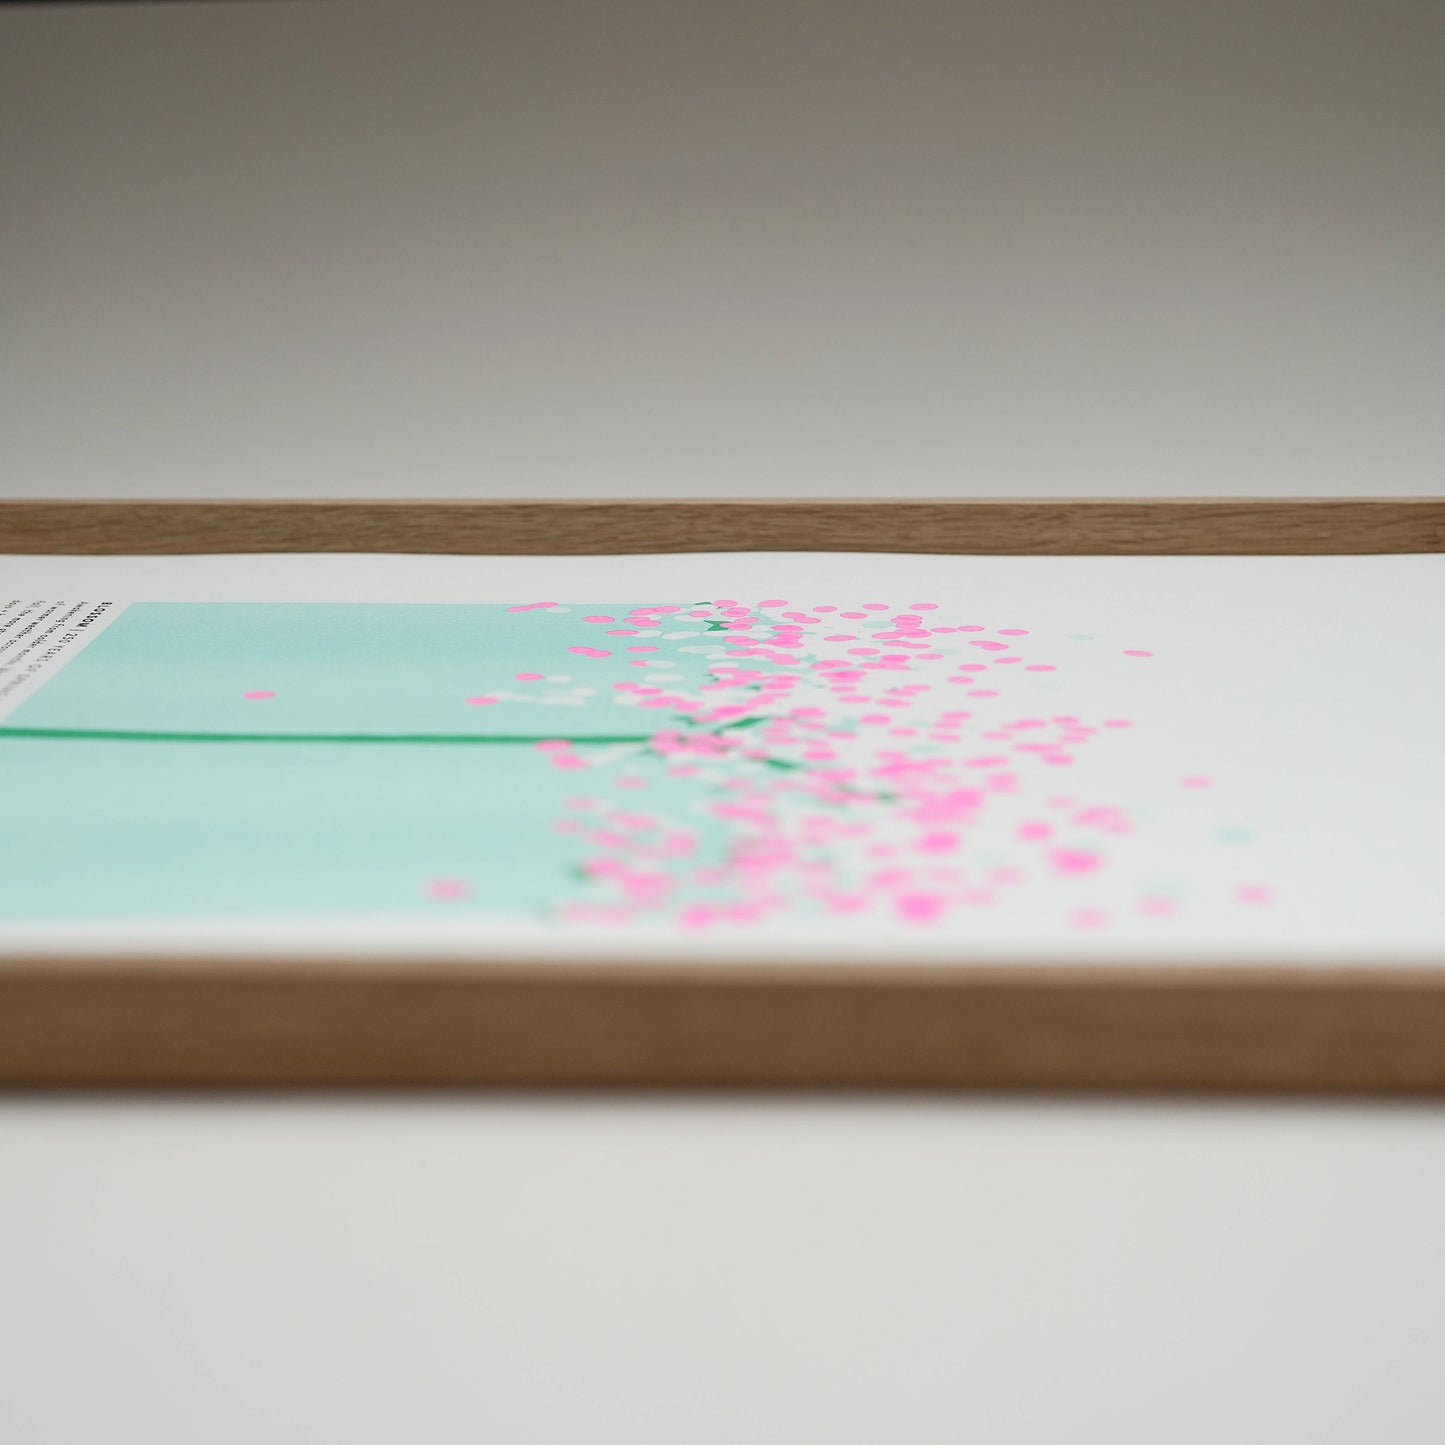
Using more than 200 years of daily temperature data from across the UK, I created a scoring system that rewarded years where the weather gently and consistently increased from week to week.
Beginning at the start of November, which marks the meteorological winter, and ending at the end of May, I ultimately created a single score for a single year. Where the years themselves are ordered from left to right, beginning in 1773 until now.
The blossoms blooms represent this score. The further they fall, the higher they scored. This means they would have likely bloomed earlier in the year. As you can see from the pattern, there is no real pattern. Scores scattered as blossom fall.
Slow and steady wins the race.
Data Source
Met Office